Like the old adage ‘can’t see the forest for the trees’ it can be difficult for even the most seasoned field biologist to clearly understand how a population is doing without understanding the uncertainty of how the population was counted, i.e., the population abundance estimate. Land managers need accurate and precise abundance estimates to effectively conserve and manage wildlife.
This is particularly true for Roosevelt elk (Cervus canadensis roosevelti; also known as Olympic elk, hereafter ‘elk’), a regal yet secretive animal living within the temperate rainforests of BCs coast. Named after President Theodore Roosevelt, these gregarious ungulates are one of six subspecies of elk to have existed in North America, and one of four to occur in Canada (Bryant and Maser 1982). Despite being the largest of the elk, with males carrying massive and rugged antlers (Qualye and Brunt 2003), their requirement of dense forested habitat for security and forage makes it difficult to accurately inventory this species. Add to that the importance of elk to numerous coastal and interior First Nations, BC resident hunters, guide outfitters, naturalists and the general public, and the need for accurate and precise population estimates becomes all to clear.
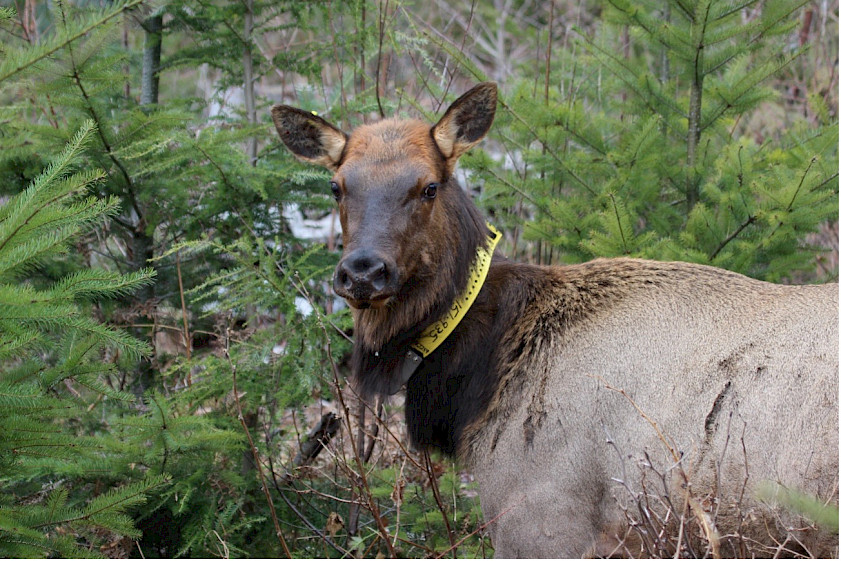
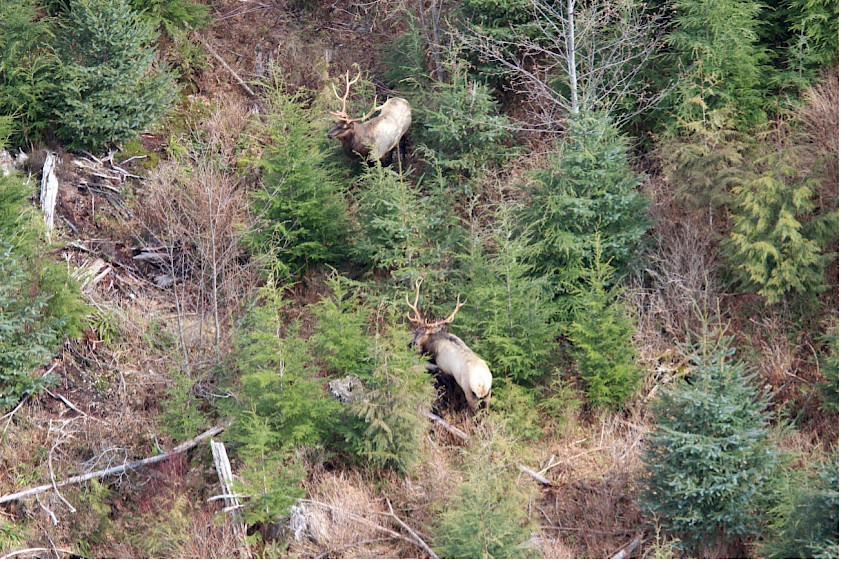
Figure 1. Female (top) and male (bottom) adult Roosevelt elk.
Our project is looking to improve the accuracy of elk population estimates by incorporating imperfect detection (i.e., the animals not seen). Current regional inventory methods involve aerial surveys with corrections for sightability based on the subjective assessment of several factors informed by professional expertise. However, the accuracy of these corrections is highly variable, subject to bias, and does not involve estimates of precision / uncertainty (e.g., confidence intervals).
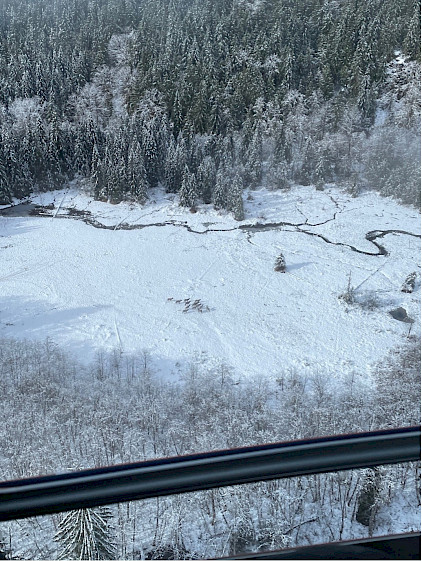
Figure 2. Inventorying elk via aerial minimum count surveys – a relatively easy feat for a herd of females in open riparian habitat, against snow.
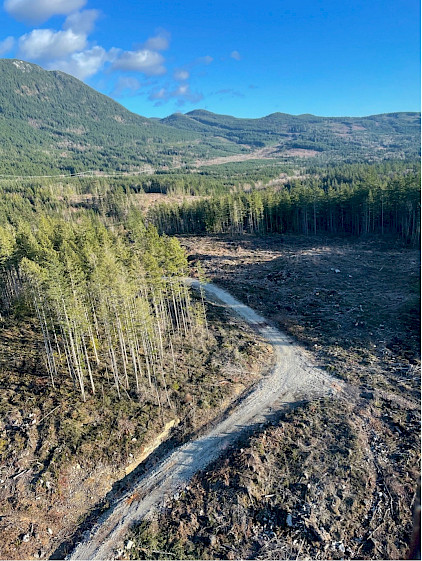
Figure 3. Inventorying elk via aerial minimum count surveys – a little tougher for a herd of females in a recent cutblock, without the backdrop of snow.
This project is taking a multi-year approach using collared and non-collared elk to estimate abundance and precision via: 1) aerial sightability survey data fitted to logistic regressions using a modified Horvitz-Thompson or a Bayesian approach (Steinhorst and Samuel 1989, Fieberg et al. 2013); and 2) camera trap survey data fitted to Spatial Mark-Resight, Spatial Capture-Recapture for categorically marked populations, and Distance Sampling models (Howe et al. 2017, Whittington et al. 2018, Augustine et al. 2018). Simulation results suggest that Bayesian logistic regression models eliminate the right-skewed bias associated with modified Horvitz-Thompson correction factors, but still yield imprecise and inaccurate estimates. In contrast, Spatial Mark-Resight models, fit to simulated camera data, yield more accurate and precise estimates, but study design will influence results (i.e., number of cameras and collars). We anticipate that Distance Sampling models may perform well, as they explicitly consider group size. If partially (i.e., antlered / antlerless) or unmarked models prove successful, the lessons learned will be translatable to other species of management interest, such as Columbian black-tailed deer (Odocoileus hemionus columbianus). Camera trap surveys may be quite cost-effective, inventorying multiple species simultaneously.
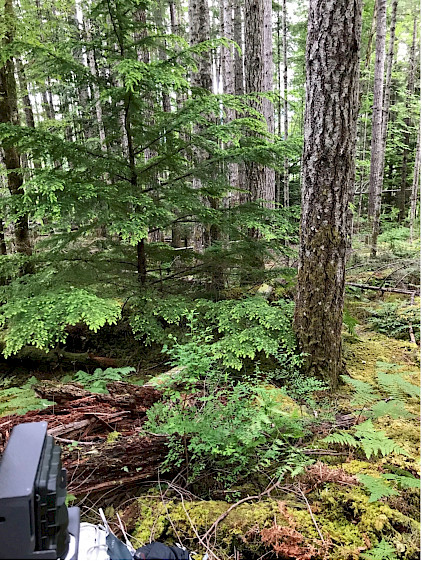
Figure 4. Deploying cameras within dense forested habitat, areas that are near impossible to spot elk aerially.
The first year will focus on the ‘closed’ elk population within the Sechelt Peninsula, where ~5% of animals are collared (9 out of estimated 222), compared to 0-8% in other South Coast Region Elk Population Units. Our team deployed 57 cameras in June, 2021, and we are prepping to retrieve the first set of images by the end of September, 2021. Stay tuned!

Figure 5. Skwawka Elk Population Unit, at the northern end of the Jervis Inlet, was a contender for the camera trap study but the relative inaccessible and fewer collared elk put it on the list for future surveys.
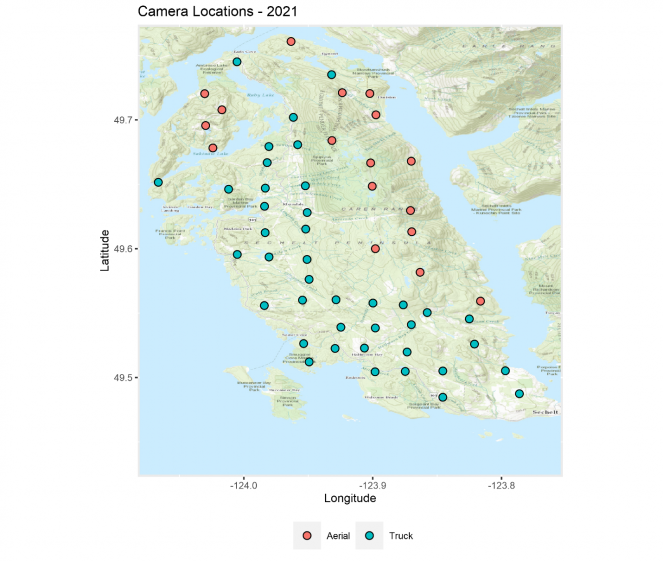
Figure 6. Locations for the 57 cameras deployed in Sechelt Peninsula in June, 2021, either by truck or aerially. This grid set up has cameras placed ~1.8-3.2 km apart to account for species with core home ranges ~15-45 km2 (e.g., both elk and deer).
This is a project led by the Ministry of Forests, Lands, Natural Resource Operations and Rural Development – South Coast Region (Joanna Burgar, Dan Guertin, Darryl Reynolds, John Kelly, Josh Malt), partially funded by Together For Wildlife (BC government) and shishalh Nation.
Blog prepared by Joanna Burgar.
References:
Bryant, L.D. and C. Maser. 1982. Classification and distribution. Pp. 1–60 in J.W. Thomas, and D.E. Toweill, eds. Elk of North America: ecology and management. A Wildlife Management Institute Book. In coop. with U.S. Dep. Agric. For. Serv., Stackpole Books, Harrisburg, PA. 698pp.
Augustine, B. C., J. A. Royle, M. J. Kelly, C. B. Satter, R. S. Alonso, E. E. Boydston, and K. R. Crooks. 2018. Spatial capture–recapture with partial identity: An application to camera traps. The Annals of Applied Statistics 12:67–95.
Fieberg, J., M. Alexander, S. Tse, and K. St. Clair. 2013. Abundance estimation with sightability data: a Bayesian data augmentation approach. Methods in Ecology and Evolution 4:854–864.
Howe, E. J., S. T. Buckland, M. Després‐Einspenner, and H. S. Kühl. 2017. Distance sampling with camera traps. Methods in Ecology and Evolution 8:1558–1565.
Quayle, J.F. and K.R. Brunt. 2003. Status of Roosevelt Elk (Cervus elaphus roosevelti) in British Columbia. BC Ministry of Sustainable Resource Management, Conservation Data Centre, and BC Ministry of Water, Land and Air Protection, Biodiversity Branch, Victoria, BC. 31pp.
Steinhorst, R. K., and M. D. Samuel. 1989. Sightability Adjustment Methods for Aerial Surveys of Wildlife Populations. Biometrics.
Whittington, J., M. Hebblewhite, and R. B. Chandler. 2018. Generalized spatial mark-resight models with an application to grizzly bears. Journal of Applied Ecology 55:157–168.